The advent of the internet and the rise of digital technologies have transformed the way we live, work, and play. As we find ourselves increasingly reliant on web applications, the importance of Web Performance has never been more evident. In this post, we'll go over some basics of Web Performance, why Web Performance matters, and look at some real production data, how to collect it, and analyse it.
Understanding Web Performance and the need for speed
Web Performance is the amalgamation of objective measurements and the perceived user experience of load and run time. It encapsulates how long a site takes to load, become interactive and responsive, and how smooth the content is during user interactions. It is crucial to minimise the loading and response times, making the experience as available and interactive as possible, as soon as possible. [1]
Improving the loading performance of a web page is often one of the highest value performance optimisations that can be made. Users prefer web experiences that are fast to load and smooth to interact with. Good user experience includes ensuring your page loads quickly. The longer it takes for a site to respond, the more users will abandon the page for better user experiences.
To ensure optimal Web Performance, it's essential to test and analyse in a controlled lab environments, such as your own development machine, and in real-world field conditions.
Testing in the Lab
In the lab, controlled experiments can be conducted to measure Web Performance under specific conditions. This involves using various tools and techniques to simulate user interactions, network conditions, and device capabilities. By conducting tests in the lab, developers can gain valuable insights into the performance bottlenecks of their web pages and identify areas for improvement.
Lab testing often involves the use of performance testing tools, such as Lighthouse, WebPagetest, or browser developer tools. These tools provide detailed metrics and diagnostics related to page load times, network requests, rendering, and other performance-related aspects. They allow developers to analyse critical performance indicators, such as Time to First Byte (TTFB), First Contentful Paint (FCP), and Time to Interactive (TTI), to assess and optimise Web Performance.
Testing in the Lab has the benefit of repeatable results on a predetermined software and hardware which is very useful for debugging specific performance issues that your web page might have.
Testing in the Field
While lab testing provides valuable insights, it is equally important to understand how web pages perform in real-world scenarios. Real user monitoring (RUM) allows for comprehensive performance analysis by collecting data from actual users' interactions with the website.
RUM involves embedding lightweight tracking scripts in web pages to capture real-time performance data, including page load times, rendering speed, network latency, and user interactions. This data is then aggregated and analysed to understand the actual performance experienced by users in different geographical locations, on different devices, and across various network conditions.
By monitoring Web Performance in the field, developers can gain insights into long-term trends, identify performance issues that may be specific to certain user segments or geographic regions, and make data-driven decisions to optimise performance.
Embracing Web Performance in Practice
Let's take a look at how we implemented these principles on my website, koddsson.com. I started by implementing "in the lab" tests on each pull request created on the sites repository.
Testing in the Lab
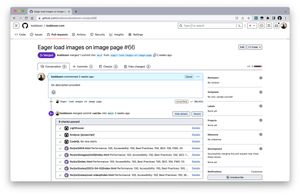
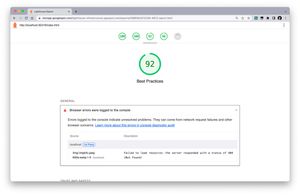
For the pull request checks I used Lighthouse CI running in GitHub Actions. Lighthouse CI runs the same Lighthouse audits as you might have already run in your Chrome DevTools so they might look familiar. These audits provide detailed metrics and diagnostics related to page load times, network requests, rendering, and other performance-related aspects. These checks are then reported back to the Pull Request so I can make sure that I haven't regressed on any of the performance metrics.
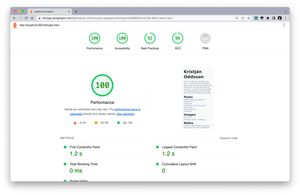
By running Lighthouse audits in the lab, I'm able to identify performance bottlenecks and areas for improvement. The critical performance indicators, such as Time to First Byte (TTFB), First Contentful Paint (FCP), and Time to Interactive (TTI), allowed us to assess and optimise Web Performance. This iterative process of testing, analysing, and optimising in the lab helped me improve the site's speed and responsiveness.
Testing in the Field
While lab testing provides valuable insights, it's equally important to understand how web pages perform in real-world scenarios. Real user monitoring (RUM) enables us to collect data from actual users' interactions with the website and gain insights into their experiences.
For koddsson.com, I implemented real user monitoring by embedding lightweight tracking scripts in web pages. These scripts capture Core Web Vitals metrics during the users visit using the web-vitals npm package which is provided by Google.
Apart from the web-vitals library, the code to send the data to a backend system for processing is pretty minimal thanks to the sendBeacon API.
import {onLCP, onFID, onCLS, onINP, onFCP, onTTFB} from 'web-vitals';
const endpoint = 'https://vitals.koddsson.workers.dev/';
function sendToAnalytics(metric) {
const body = JSON.stringify(metric);
// Use `navigator.sendBeacon()` if available, falling back to `fetch()`.
(navigator.sendBeacon && navigator.sendBeacon(endpoint, body)) ||
fetch(endpoint, {body, method: 'POST', keepalive: true});
}
onCLS(sendToAnalytics);
onFID(sendToAnalytics);
onLCP(sendToAnalytics);
onINP(sendToAnalytics);
onFCP(sendToAnalytics);
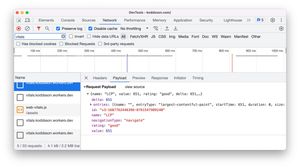
onTTFB(sendToAnalytics);If you have your browser network monitor open while visiting http://koddsson.com you should see the data being sent:
The data gets sent to a Cloudflare Worker® which saves the values sent to a database. I won't put the whole worker in this post but here's the bit that accepts a POST request:
if (request.method === "POST") {
	const payload = await request.json();
	const { name, id, value, rating, delta, navigationType } = payload;
	const timestamp = Date.now();

	try {
		await env.DB.prepare(
			`INSERT INTO recordings (id, name, value, rating, delta, navitationType, timestamp) VALUES (?, ?, ?, ?, ?, ?, ?)
		`).bind(id, name, value, rating, delta, navigationType, timestamp).run();
	} catch (error) {
		console.log(error);
	}
	return new Response("", { status: 201 });
}
This data is then analyzed to understand the actual performance experienced by users in different geographical locations, on various devices, and across diverse network conditions.
By monitoring Web Performance in the field, I'm able to identify long-term trends and uncover performance issues specific to certain user segments or geographic regions. These insights allows me to make data-driven decisions and further optimize the performance of koddsson.com in the future.
Visualising and Charting the Data
To gain a deeper understanding of the collected Web Performance data, visualising and charting the data can be immensely helpful. By visualising the data, patterns, trends, and anomalies can become more apparent, aiding in the identification of areas that require attention and optimisation.
At this point though the data is all just dumped into a database which makes it hard to gleam insights about Web Performance about it.
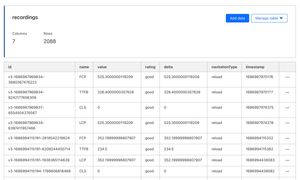
It would be really good if I could explore and graph this data for insights and overview. First we need to export the data in some easy way in a portable format. JSON seems like a logical choice so I added a endpoint the fetches all the data and some convenience filtering by the metric type.
const type = url.searchParams.get("type");

try {
	if (!type) {
	    const { results } = await env.DB.prepare(`SELECT * FROM recordings`).all();
		return Response.json(results);
	} else if (["LCP", "CLS", "FID", "INP", "TTFB"].includes(type)) {
		const { results } = await env.DB.prepare(`SELECT * FROM recordings WHERE name = ?`).bind(type).all();
		return Response.json(results);
	}
} catch (error) {
	console.error(error);
}
I then tried to load the data into various data visualisation applications and using different kind of charting libraries. These all either didn't work properly or didn't give me the results I wanted. I might have been spoilt with my previous experience with DataDog. I really wish I could load the data into a service and then easily explore it and present it in different ways. I ended up just wanting something simple and easy to manage and I actually ended up using Google Sheets with the charting function! One problem though; there doesn't seem to be a easy way to import a JSON file or endpoint. No worries, lets just add functionality to our worker to return CSV as well:
const type = url.searchParams.get("type");
const csv = request.headers.get("Accept")?.includes("text/csv");
const formatResults = csv ? ResponseCSV : Response.json;
try {
if (!type) {
const { results } = await env.DB.prepare(`SELECT * FROM recordings`).all();
return formatResults(results);
} else if (["LCP", "CLS", "FID", "INP", "TTFB"].includes(type)) {
const { results } = await env.DB.prepare(`SELECT * FROM recordings WHERE name = ?`).bind(type).all();
return formatResults(results);
}
} catch (error) {
console.error(error);
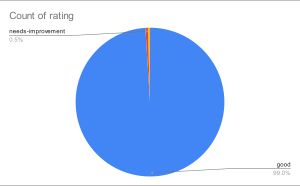
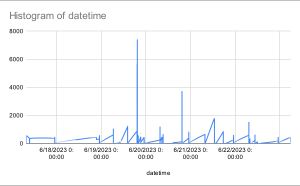
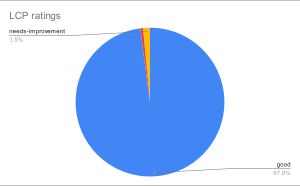
}Now I can import the CSV files into Google Sheets and start creating charts that help me (and other potential stakeholders) to visualise and better understand the data.
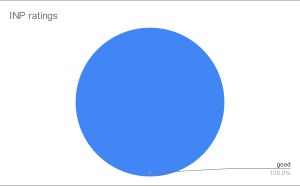
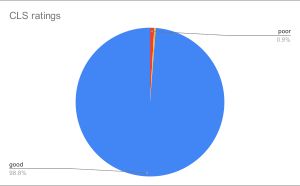
Looking Forward
Web performance is a continuous journey, not a destination. Looking ahead, I plan to continue explore other ways to enhance the site's user interface. Web Performance is a vital area that needs constant attention and optimisation, but the results are definitely worth looking into.
You should note that I did all this without spending any money. I'll concede that I don't have huge site to manage, there's not a lot of traffic right now so there isn't a lot of data to crunch but I'm also not buying some system wholesale and letting them deal with it for me. DataDog and Sentry cost some amount of money (that I don't want to pay for on such a small site like koddsson.com and which doesn't make me any money). I had to do some work but it's just installing some npm packages, writing a little JS snippet and a worker to save the metrics to a database. The hardest part so far has been graphing the data up in meaningful way.
In conclusion, Web Performance is an essential aspect of providing a smooth, user-friendly online experience. As developers, we should strive to create web pages that are not only functional but also performant. Before knowing how to make your website faster you'll need to know what things can be improved and that starts by measuring. As the Dutch say: "Meten is weten!" (To measure is to know).